Updated · first published
What is DeepCharts?
DeepCharts is a futures order-flow platform published by deepcharts.com. It combines a footprint chart (DeepChart) and an order-book liquidity heatmap (DeepDom), both fed by order-by-order MBO data. It covers the CME complex and Eurex, connecting through Rithmic, CQG or dxFeed.
How much does DeepCharts cost?
The budget splits into three parts: the platform license, discounted up to 25% with code OFF; the data feed, from $19/month with dxFeed or $57/month with Rithmic; and MBO depth, $39/month on the CME plus $65/month for Eurex. Pricing is indicative.
On futures, the market is an auction of orders, and the players who win are the ones who see that auction in full. DeepCharts is the platform that puts it in front of you: the footprint, a liquidity heatmap and a suite of proprietary indicators, all fed by order-by-order (MBO) Level 2 data. Not a diluted, delayed feed: the real book, the one institutions act on.
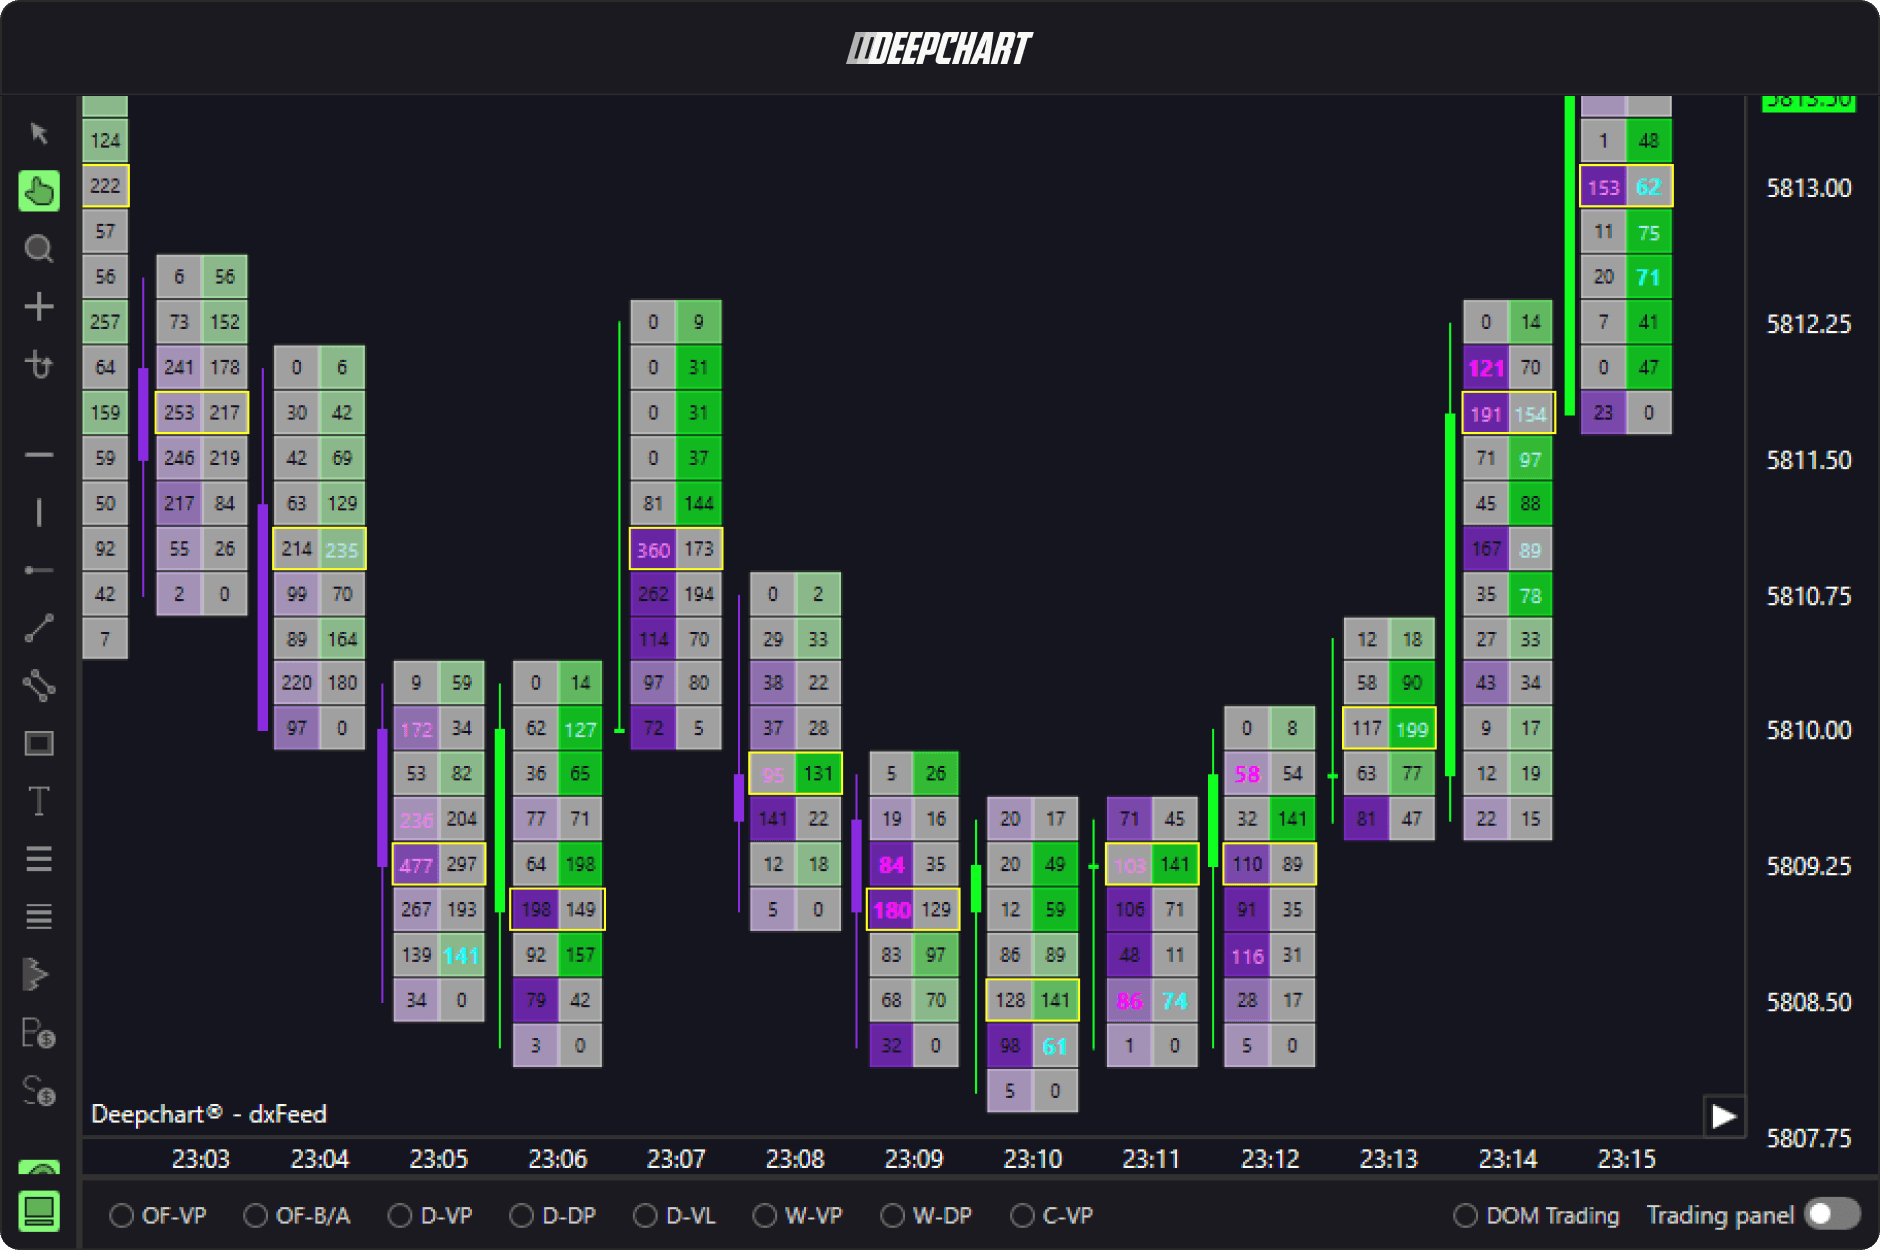
Trading futures without MBO liquidity is trading blind
A standard chart shows you price after the move. Level-1 data shows you the best bid/ask only. Neither tells you where the size is resting, who is absorbing, or when stops are about to be run. The order book, streamed order-by-order, does, and it's the difference between guessing and reading.
Proprietary indicators, not generic ones
80+ indicators ship with the platform: several built in-house and found nowhere else. A few that matter for a funded order-flow trader:
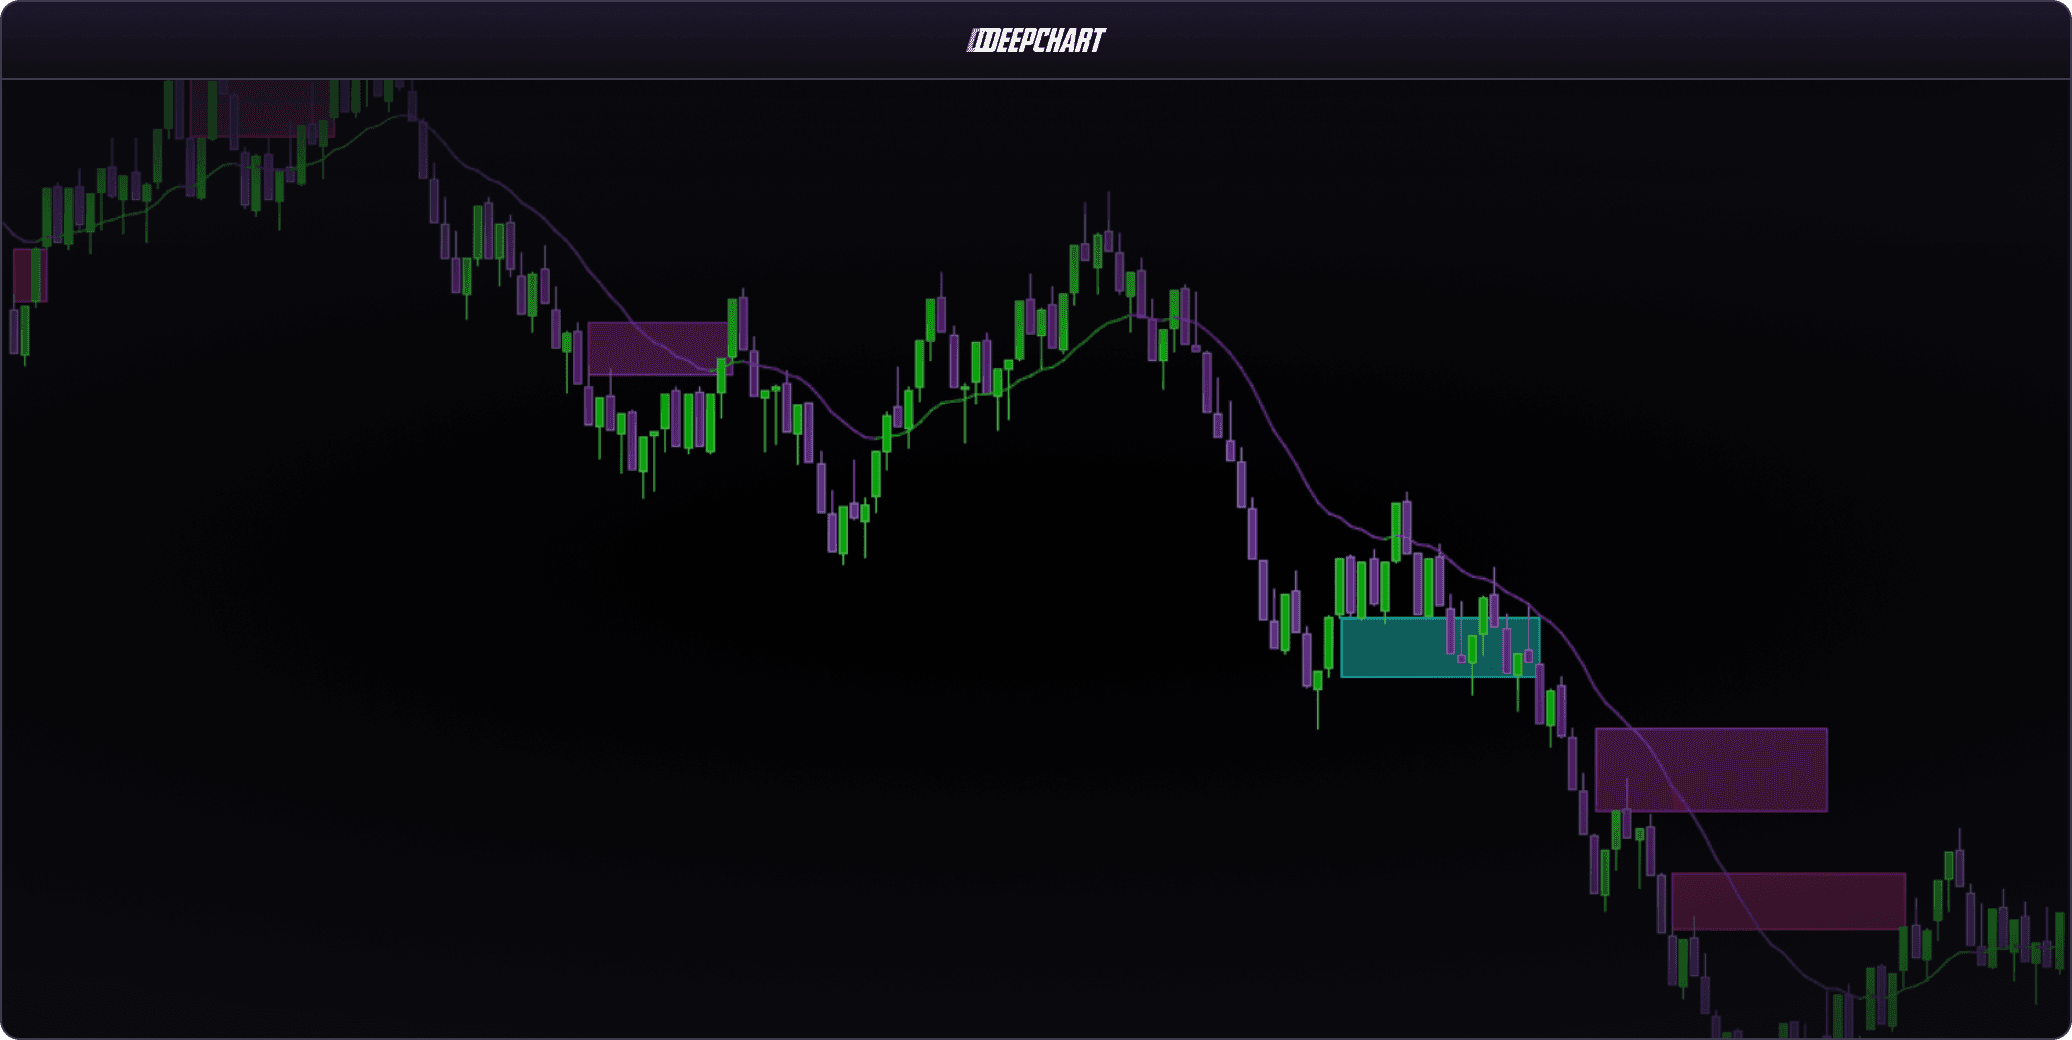
The house's proprietary trend model, built on real order effort rather than price alone.
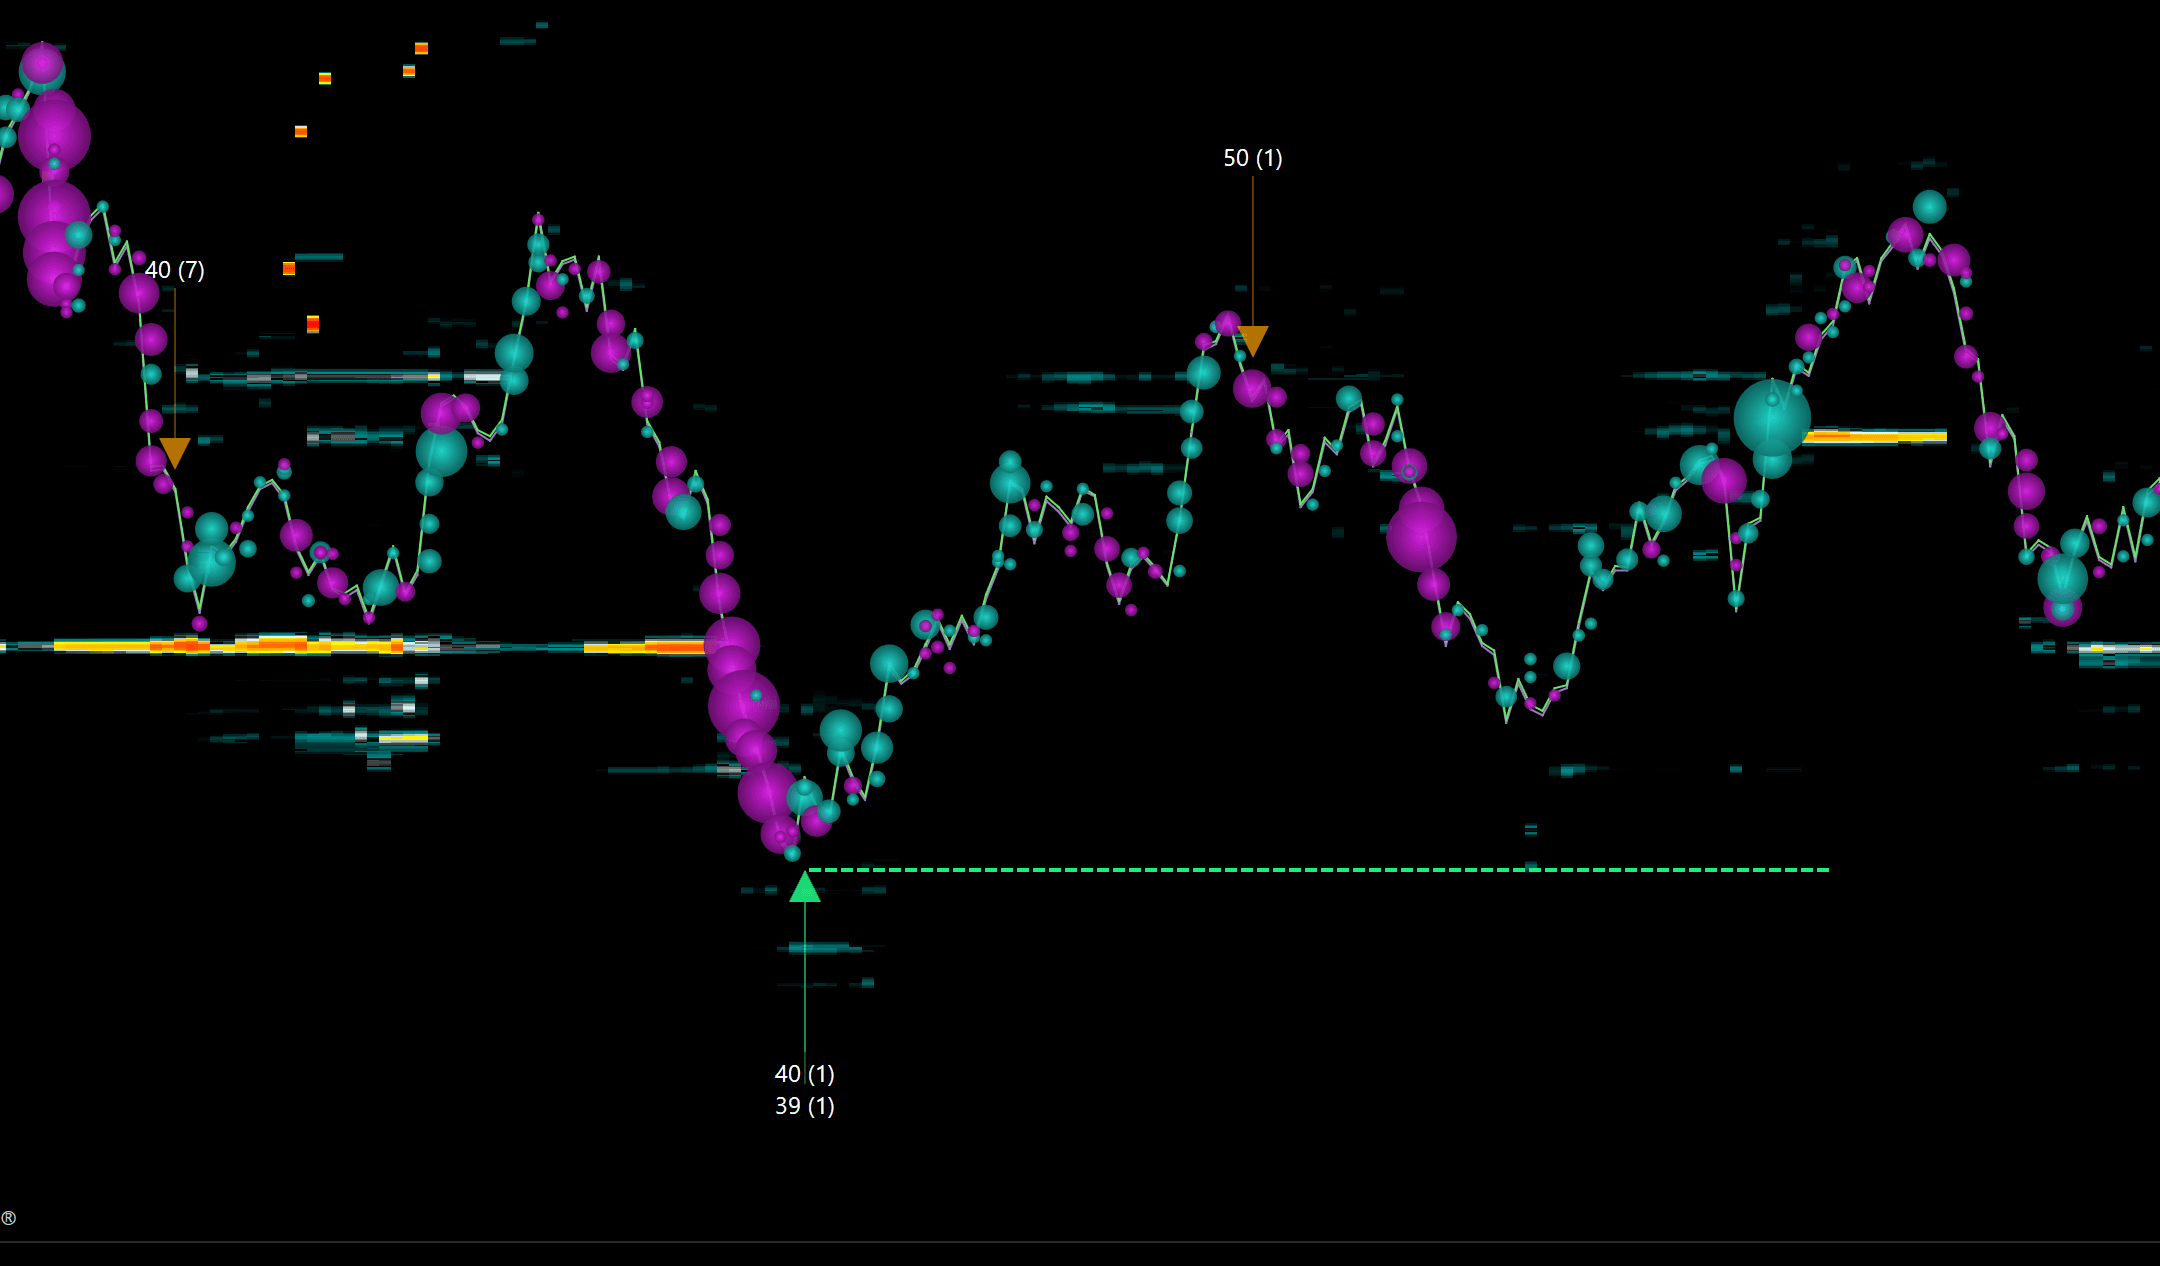
Isolates large activity from MBO data and classifies it on the chart with four symbol types.
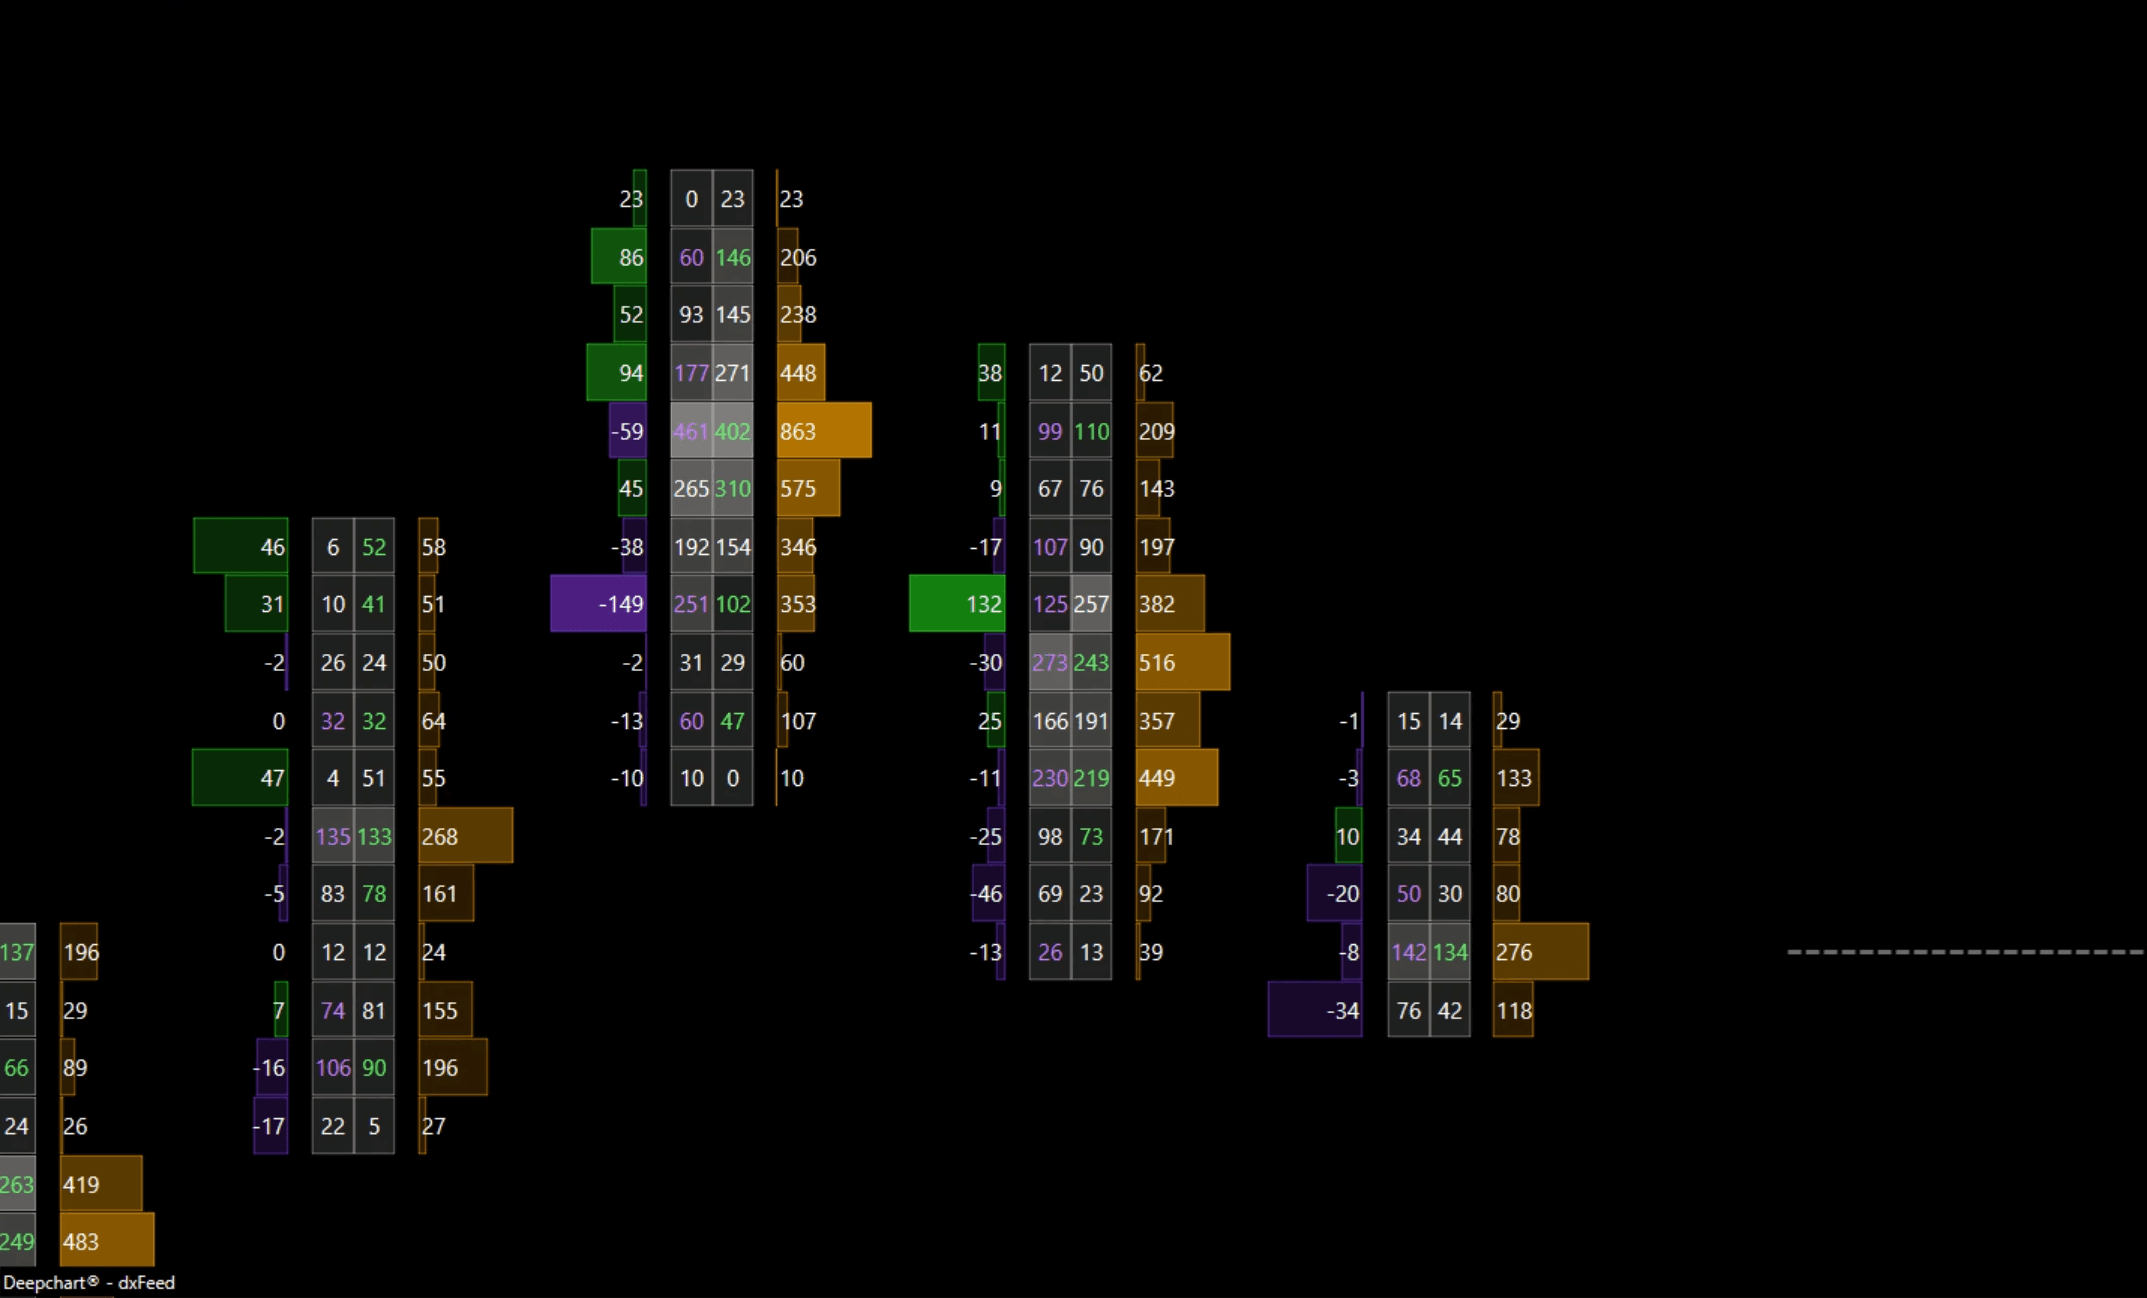
Buy/sell imbalance, cumulative delta and divergences between price and real flow.
Every candle broken down level by level, bid × ask: who attacks, who absorbs.
Tracks the diagonal imbalances that reveal which side controls the auction.
Tape speed and HFT-activity detection: when the market accelerates.
Detects order-flow patterns (acceleration, slowdown, exhaustion) plus absorption and pressure zones.
Build and backtest your own order-flow patterns, no code required.
See each concept explained in the glossary and the method in our order flow pillar.
Each tool, explained in depth
A dedicated guide for every key tool: what it is, how to read it and what it reveals about the smart money.
Every candle opened price by price: who attacks, who absorbs, where volume really trades.
Resting liquidity made visible, order by order: the walls big players leave before they act.
The numeric read of the tug-of-war: how much buy vs sell aggression, bar after bar.
Large orders hiding in small slices, made visible to follow absorption.
Footprint imbalances: where one side overwhelms the other and marks control.
The real pace of executions: when the market accelerates, slows, or climaxes.
Large activity isolated and classified on the chart, from MBO data.
The price ladder with resting size on each side: the live order book, price by price.
The inefficiency a too-fast move leaves behind, and that price often returns to fill.
A trend model that judges the real effort in orders, not just price.
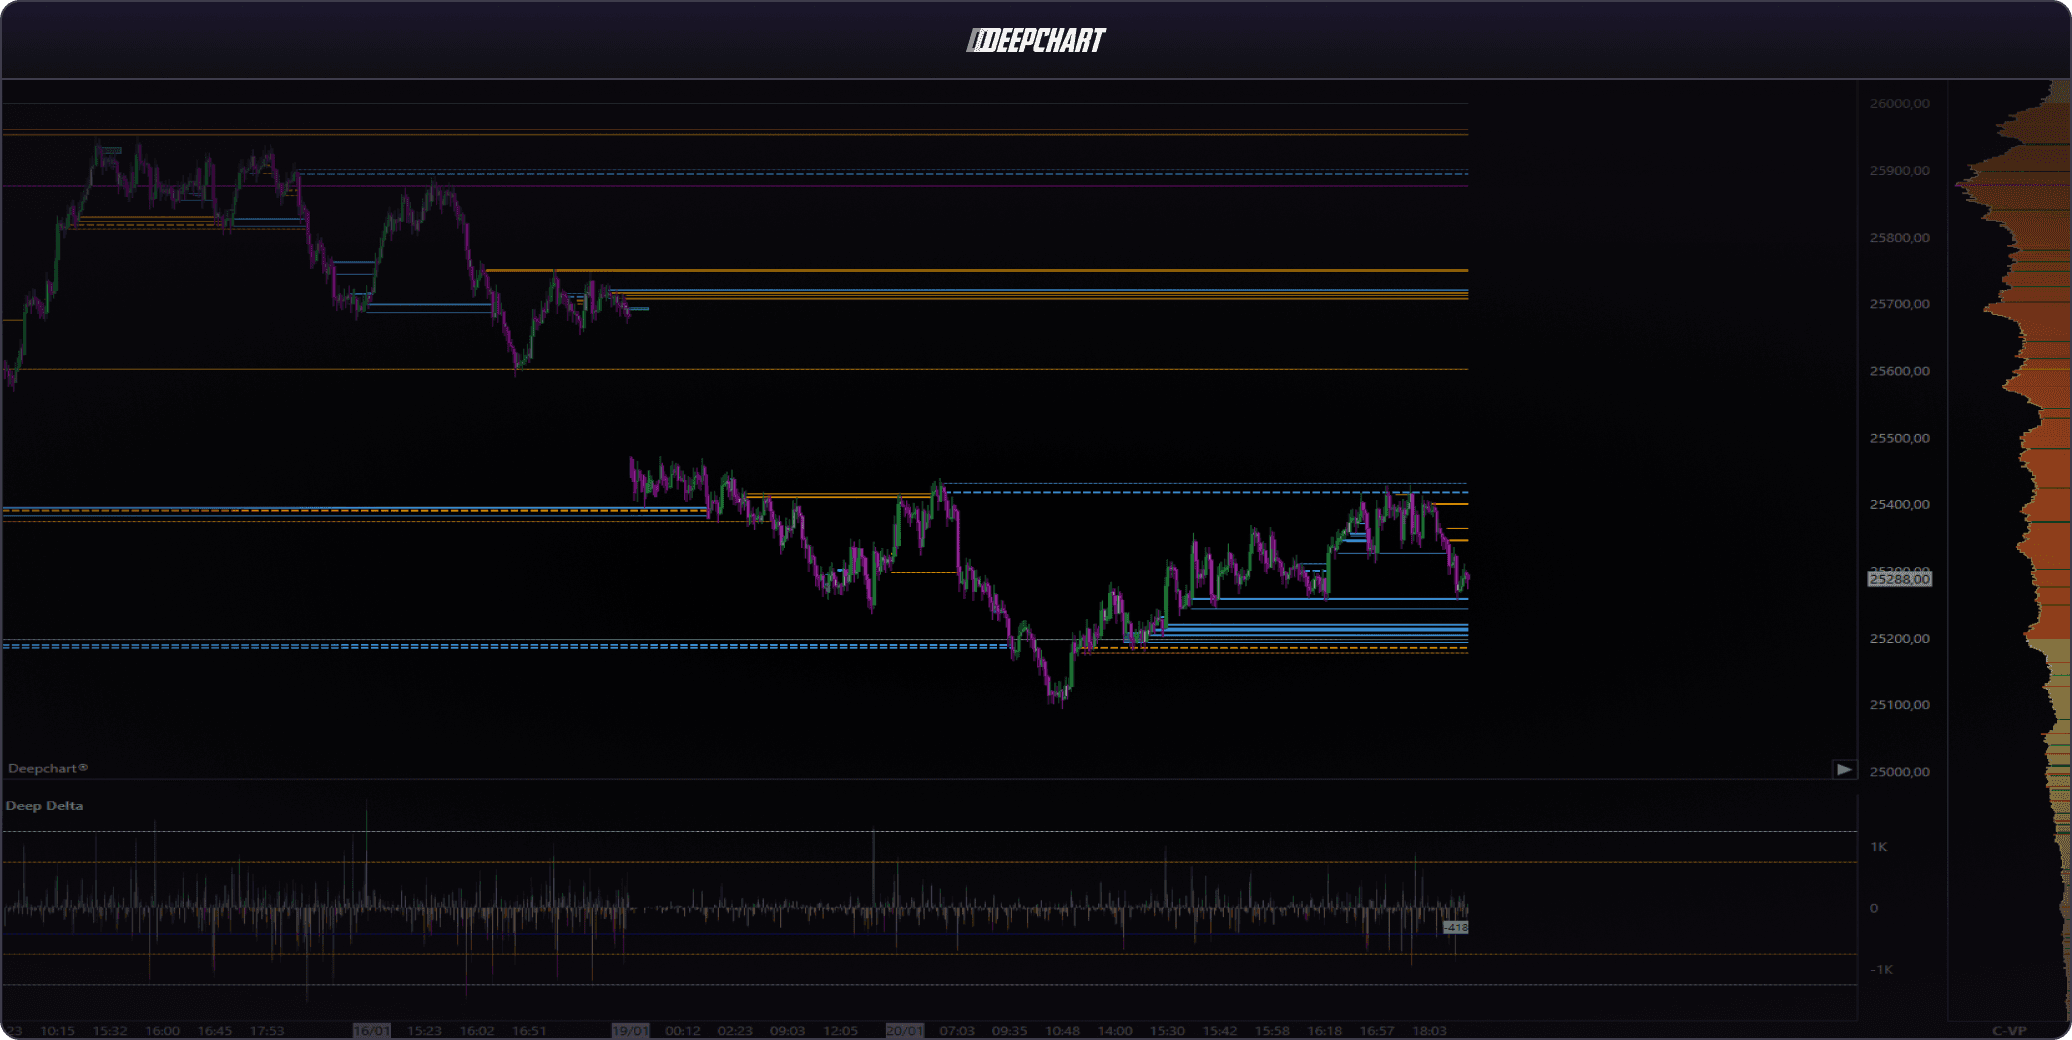
Where the market traded most: the reference prices the flow revisits.
Replay a session order by order, to the tick, to train on real order flow.
Build and backtest your own order-flow patterns, without writing a line of code.
Know, from the data, when stops get triggered, to fade the 'dumb money' instead of following it.
The Opening Range Breakout, no longer drawn by hand: range, probability-based targets and a daily bias, computed.
Two modules: the flow's patterns on one side, pressure and absorption zones on the other.
A deliberately rare detector: it only speaks when a passive wall genuinely refuses to give way.
Keep the volume profile's levels, drop the histogram cluttering your chart.
The same price axis, four reads: how much traded, by whom, and with what conviction.
The profile no longer follows the clock, it follows the move, and redraws at every swing.
Calls on one side, puts on the other, strike by strike, and the two walls framing the session.
A map of dealer gamma exposure, strike by strike: where hedging flow will concentrate.
Dealer gamma exposure painted straight onto price, level by level, through time.
Session boundaries derived from gamma exposure: where hedging flow changes nature.
Large option tickets plotted on your chart: call or put, opening or closing, bought or sold.
The range the options market prices for the session, your frame for targets and stops.
The heatmap shows where liquidity sits. The Liquidity Scan tells you how much of it there is, on both sides, second by second.
A wall that rebuilds itself three times at the same price does not mean the same thing as a wall that vanishes.
The tape stops scrolling in a column: it lands on the chart, at the time and price where it happened.
The first hour frames the day. Provided the lines are drawn in the right place, at the right hour.
A moving average ignores volume. VWAP answers the only question that matters: at which price did the market actually trade.
The rule that saves you is not the one you set for yourself, it is the one the platform enforces in your place.
DeepGamma: the option flow that moves ES
Market makers who sell SPX options must hedge in ES futures, continuously. DeepGamma maps that obligatory flow (GEX Profile, gamma heatmap, Gamma Bands, large option flows) inside the same chart as your order flow, on real Cboe participant data. Classic ships with the Full Advanced plan, the full suite with the Pro plan. Read the DeepGamma guide.
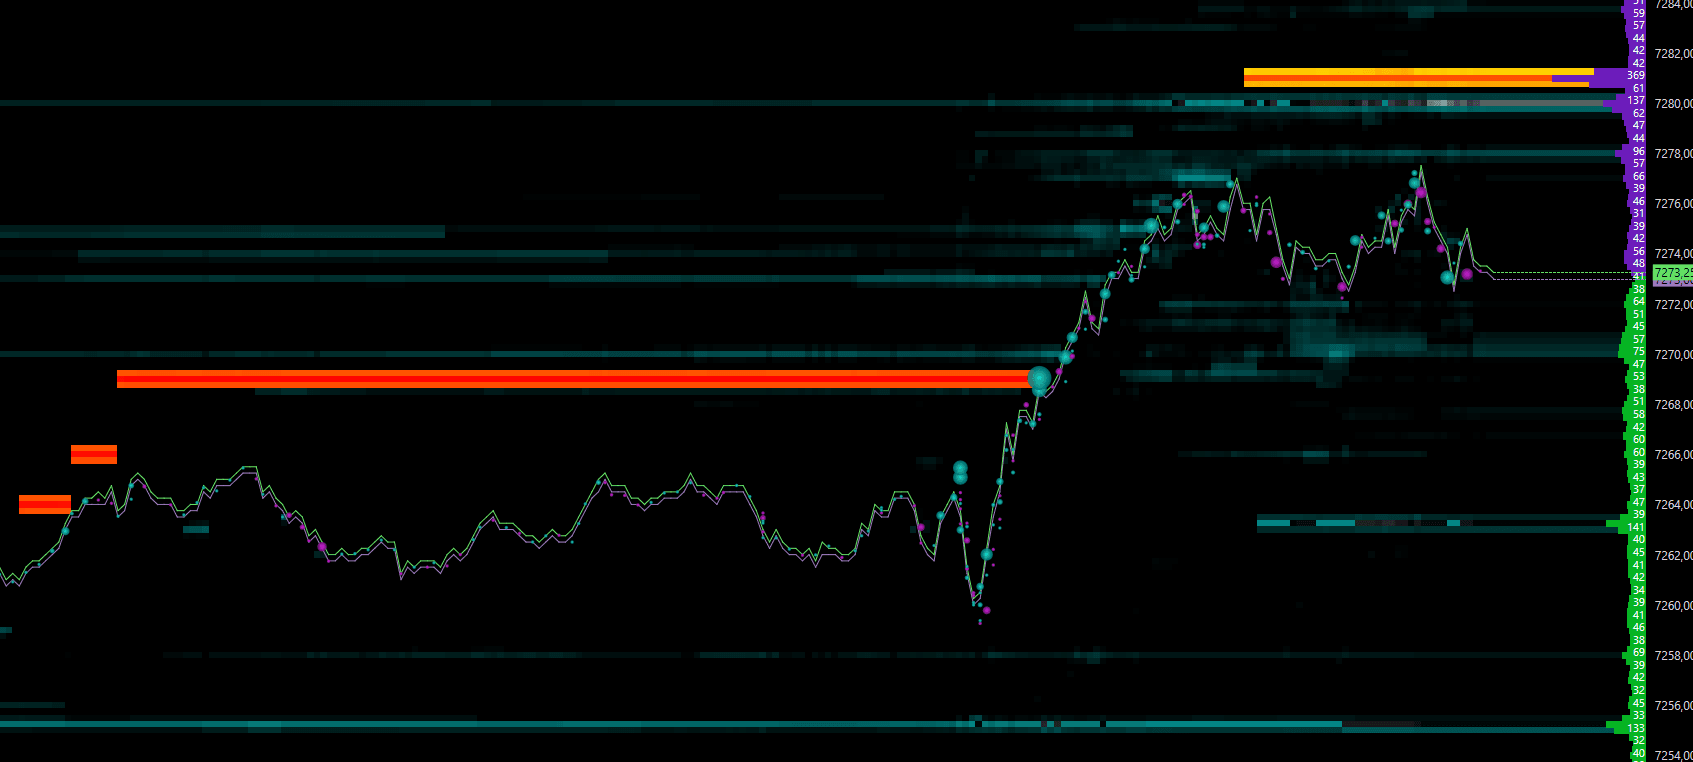
The DeepDom liquidity heatmap (MBO Level 2)
DeepDom turns the MBO book into a live picture of resting liquidity. Because it reads the book order-by-order, it can automatically flag the absorption walls the smart money leaves, detect iceberg orders as they reload, and show stop runs as they happen, so you fade the crowd instead of joining it. Read the full method in our heatmap guide.
Invest in your work tool
Yes, DeepCharts is a paid add-on. So is every professional's data. The question isn't the monthly cost, it's whether you're willing to see the same thing the institutions see. Here's what it takes:
 / Rithmic · Indicative pricing, may change.
Go deeper: the plan-by-plan discounts are on the DeepCharts promo code page, our full verdict in the DeepCharts review, and the head to head in DeepCharts vs Bookmap.
One tool, CME and Eurex
DeepCharts covers the CME complex (NQ, ES, CBOT, COMEX, NYMEX) and Eurex (the FDAX) from the same platform, so you read NQ, ES and FDAX with one setup and one method.
Get it funded, with controlled risk
You don't have to pay for the tool and the risk. Phidias bundles DeepCharts natively on a funded account, so you read the flow with their capital. Compare the market in the comparator, or read the order-flow prop firm guide.
FAQ
What is DeepCharts?+
DeepCharts is an order-flow analysis and trading platform for futures. It renders the footprint, a liquidity heatmap (DeepDom) and 80+ indicators, several of them proprietary, on top of high-granularity data.
Why does DeepCharts need MBO Level 2 data?+
MBO (market-by-order) is the order book streamed order-by-order rather than as aggregated price levels. That's what powers the iceberg detection, absorption walls and stop-run reads: you literally see the same book the big players act on.
How much does DeepCharts cost?+
There are three parts: the platform license (currently up to -25% with code OFF during launch season, depending on the plan), the data feed (dxFeed from $19/mo, or Rithmic from $57/mo), and the MBO market depth ($39/mo for CME, +$65/mo for Eurex). Figures are indicative and can change.
Is DeepCharts worth the cost?+
It's a paid tool, but it's your workstation. Trading futures on delayed or Level-1 data is trading blind; DeepCharts puts institutional-grade order flow in front of you. Treat it as an investment in your edge, not an expense.
What is DeepGamma?+
DeepGamma is the gamma-exposure and option-flow module added to DeepCharts in 2026: GEX Profile, GEX Heatmap, Gamma Bands and large option flows, computed on real Cboe participant data for SPX. DeepGamma Classic ships with the Full Advanced plan; the full suite comes with the Pro plan.
Can I use DeepCharts with a prop firm?+
Yes. Phidias bundles DeepCharts natively, so it's included on a funded account. Use code OFF on the platform license, then trade the flow with the firm's capital.
Want to get better at order flow?
We discuss flow, liquidity and our trades live, every day, on the OrderFlowFutures Discord. Join us, it's free.
Join the Discord for free7 online·38 members·Free · instant access